We’re lowering speed limits because if you hit someone at 30mph they’re five times more likely to die than if you hit them at 20mph.
The work is part of the Mayor’s Vision Zero policy which aims to see no one killed or seriously injured on our roads by 2041.
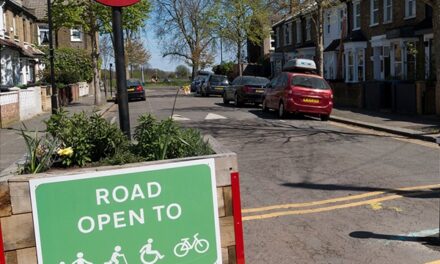
Safer speeds made a large portion of London safer for people to live, work and commute, encouraging more Londoners out of their cars to walk, cycle and use public transport. More people using healthier and more sustainable forms of travel is vital to reducing congestion and air pollution.
Give us your views
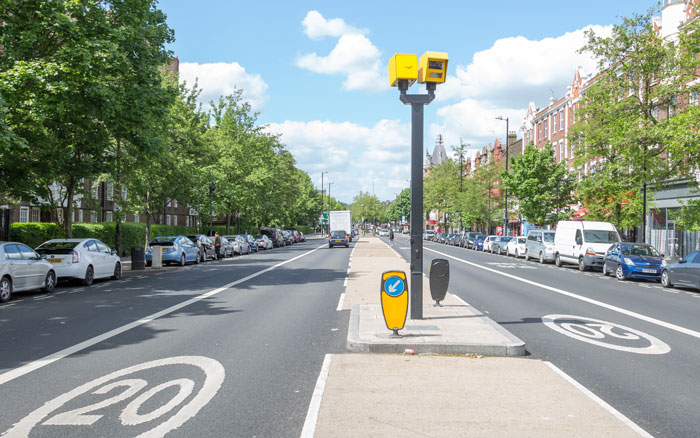
In March 2020, we introduced a 20mph speed limit on our roads in central London. We’re now lowering the speed limit by 10mph on another 140km of the roads we manage – this should be done by May 2024.

Advertisement

Advertisement

We want to hear your views before the changes are made – we’d also like your comments and experiences on the new lower speed limits once the works are complete.
Work is already underway to introduce a 20mph speed limit on 28km of roads within the boroughs of Camden, Islington, Hackney, Haringey and Tower Hamlets. See details of the next locations and feed into the discussion on the Lowering speed limits discussion page.
We will closely monitor changes we make to our roads. This may include looking at possible effects on nearby roads as needed. You can see more of our work and research into reducing road danger on the Road safety data page.
The Metropolitan Police enforces speed limits across most of London’s roads. We work with the police to increase their capacity to take enforcement action against drivers and riders who speed.
The Met is currently on target to be able to take action on a million speeding offences by 2024. In 2021/22, they enforced 476,685 speeding offences, an increase of 72% compared to the previous year.
Learning from collision data
Early indications show a significant reduction in the number of collisions since the 20mph speed limit was introduced on roads within the central London Congestion Charging Zone in 2020.
Data collected from 1 May 2020 to 30 June 2022, when compared to a similar seasonally-matched period before lower speed limits were implemented, shows the number of collisions fell 25% (from 405 to 304), and collisions resulting in death or serious injury fell 24% (from 94 to 71).

Advertisement
The reduction in collisions resulting in death or serious injury on roads within the central London Congestion Charging Zone should be seen in the context of a London-wide reduction in collisions resulting in death or serious injury of around 10% over the same period. This demonstrates that reducing speeds leads to greater benefits than on roads where speeds have not been reduced.
Advertisement
Collision data for the whole of London is provided in csv extracts on our website every year. (The 2022 data is still provisional and will be replaced by a final version.) See the Road safety data page.
A detailed report will be commissioned for all results as of 2023.
Our calculations
To provide a comparable baseline, the pre- and post-implementation time periods used for the casualty statistics were seasonal matched. This means that like-for-like months were compared before and after the implementation to account for changes to collision rates across the year.
- Baseline: 26 months before implementation covered 1 May 2017 to 30 June 2017 and 1 December 2017 to 30 November 2019
- Post-implementation period: 1 May 2020 to 30 June 2022
Note: The provisional 2022 figures for collisions are being checked by the Department for Transport (unlikely to change much) and should be final by early August 2023.
- Collision data before and after implementation
- Speed data before implementation
- Speed data after implementation
- Healthy Streets Mystery Shopper surveys before and after implementation

Designing for lower speeds
There are many different ways to encourage people to drive at lower speeds, but evidence shows that self-enforcing speed limits are the most successful way to reduce speeds.
A self-enforcing speed limit means that people are more likely to drive within the signed speed limit because they feel it’s the easiest and safest speed to drive along that road. This is generally because of the way the road looks and has been designed.
Advertisement
Some of the design and engineering measures used to lower speeds are:
- Signs
- Road markings
- Speed cushions
- Raising pedestrian crossings
- Widening footways for people walking
- Giving more space to people cycling
- Reallocating traffic lanes to buses
- Removing the white line in the centre of a road
- Changing the surface of the road
- Creating curves along the road that requires vehicles travelling in different directions have to slow down or give way
- Introducing more traffic islands in the centre of the road
- Placing trees, planters and parklets along the roadside or in the centre of the road
There’s no ‘one size fits all’ approach to reducing vehicle speeds. We use different measures depending on the type of road, who uses the road and the road space available.
Advertisement

We’ve published a toolkit outlining the various speed reduction measures that can be used when designing streets in London.
It can be used by anyone seeking to make our streets safer, healthier and more attractive for walking and cycling. However, it will be of particular relevance to local authorities responsible for implementing speed reduction programmes.
We’ll continue to monitor the effectiveness of these measures in lowering speeds, so we can determine if more design changes are needed.
Effect on traffic and pollution
Imperial University’s evaluation of 20mph zones in London shows they have no net negative impact on exhaust emissions.
It also shows that in 20mph zones vehicles move more smoothly, with fewer accelerations and decelerations, than in 30mph zones. This smoother driving style actually reduces particulate emissions from tyre and brake wear.

Advertisement

We closely monitor changes we make to our roads. This may include looking at possible effects on nearby roads as needed. You can see more of our work and research to into reducing road danger on the Road danger reduction page in Publications & reports.