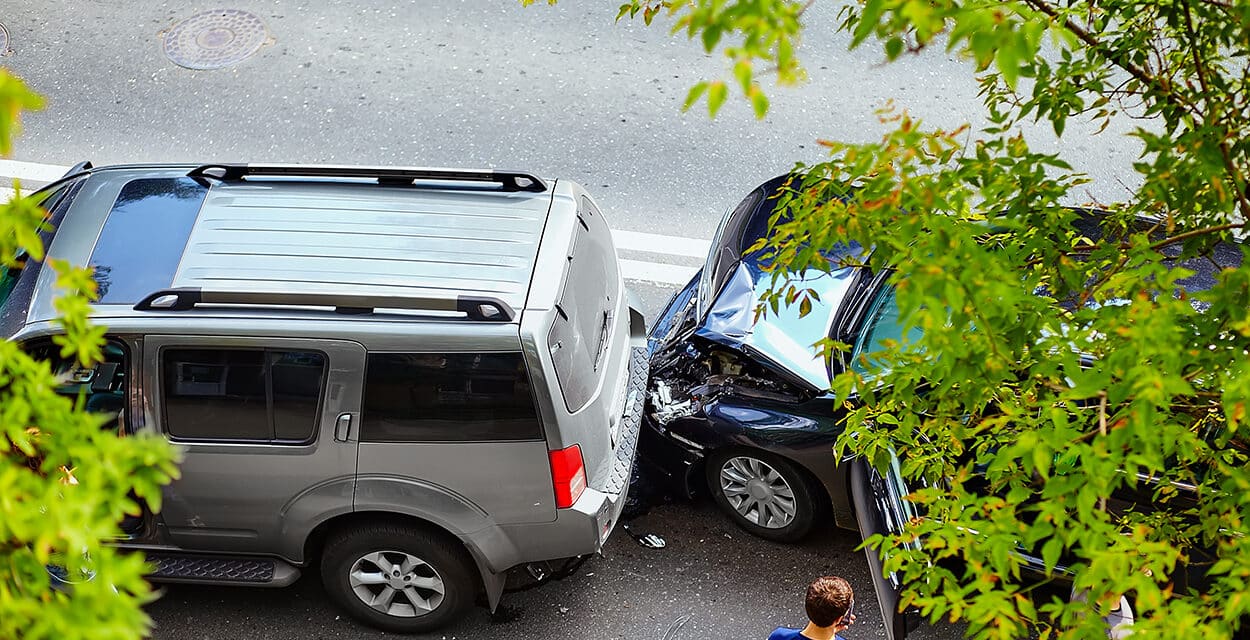
A new study has revealed that the most dangerous manoeuvre on British roads for car drivers is turning right. The study by Forbes Advisor used data from the Department for Transport’s 2021 annual report on reported road casualties in Great Britain from 2012 to 2021 to determine which manoeuvres resulted in the most collisions for each type of vehicle.
The manoeuvres resulting in the most collisions for each vehicle type
Cars had the greatest number of collisions on British roads in each year from 2012 to 2021, and the manoeuvre that resulted in the most collisions was turning right, with 186,009 recorded collisions. Slowing or stopping resulted in the next most collisions, with 130,709 recorded in this time period. With 112,755 recorded incidents, the third most common cause of collisions for cars was being held up while waiting to go.
For motorcycles, overtaking a moving vehicle on the offside resulted in 14,324 recorded collisions, the highest amount for the vehicle type. Slowing or stopping caused the second most collisions for motorcycle riders, with 10,003 reported collisions. The third most dangerous manoeuvre for motorcycle riders was going ahead on a left-hand bend, with 8,992 reported collisions.
Advertisement
The most dangerous manoeuvre for light goods vehicles was turning right, with 12,418 recorded collisions from 2012 to 2021. Slowing or stopping caused the next most recorded collisions, with 10,151 in total. Light goods vehicles were involved in 7,266 recorded collisions while parked, the vehicle type’s third most frequent.
Pedal cycles were involved in most collisions while turning right, with 10,070 such incidents reported between 2012 and 2021. Moving off resulted in the next most collisions for pedal cycles, with 4,911, while going ahead on a right-hand bend came third, with 4,643 recorded collisions.
For buses or coaches, the most frequent type of recorded collision was while slowing or stopping, with 7,398 recorded between 2012 and 2021. Moving off resulted in the second most recorded collisions in that time, with 6,505 recorded in total. In third, being held up while waiting to go was the cause of 2,538 collisions for buses or coaches.
Heavy goods vehicles (HGVs) were involved in the most collisions while slowing or stopping, with 3,714 recorded collisions between 2012 and 2021. 2,859 recorded collisions involving HGVs occurred while they were parked. Turning right resulted in the third most collisions for HGVs, with 2,857 recorded collisions.
Table showing the top 3 manoeuvres of vehicles involved in reported collisions 2012-2021 aggregated (‘going ahead other’ removed)
| Vehicle | Manoeuvre 1 | Manoeuvre 2 | Manoeuvre 3 |
| Buses or coaches | Slowing or stopping – 7,398 collisions | Moving off – 6,505 collisions | Waiting to go – held up – 2,538 collisions |
| Cars | Turning right – 186,009 collisions | Slowing or stopping – 130,709 collisions | Waiting to go – held up – 112,755 collisions |
| Heavy goods vehicles | Slowing or stopping – 3,714 collisions | Parked – 2,859 collisions | Turning right – 2,857 collisions |
| Light goods vehicles | Turning right – 12,418 collisions | Slowing or stopping – 10,151 collisions | Parked – 7,266 collisions |
| Motorcycles | Overtaking moving vehicle – offside – 14,324 collisions | Slowing or stopping – 10,003 collisions | Going ahead left-hand bend – 8,992 collisions |
| Other or unknown vehicles | Turning right – 2,508 collisions | Parked – 1,608 collisions | Moving off – 1,514 collisions |
| Pedal cycles | Turning right – 10,070 collisions | Moving off – 4,911 collisions | Going ahead right-hand bend – 4,643 collisions |
Source: Department for Transport
Other or unknown vehicles include all vehicles that are not in the main vehicle type list; these include ridden horses, goods vehicles with unknown weight and unknown vehicle types.
Which vehicle types are disproportionately at risk on average while performing which manoeuvres?
Advertisement
The study also analysed which vehicle type faced the most risk of a collision on average for each manoeuvre.
Heavy goods vehicles experienced collisions nearly six times more frequently than the average while changing lanes to the left (585.6% of the average) and over five times as frequently while changing lanes to the right (533.37% of the average).
Cars were disproportionately involved in collisions while turning right (114.25% of the average), waiting to turn left (117.14% of the average), waiting to turn right (116.62% of the average), and being held up while waiting to go (116.81% of the average).
Motorcycles faced the most disproportionate occurrence of collisions while overtaking and going ahead on bends. They had over three times the average occurrences of collisions while overtaking on the nearside (321.93% of the average), over three and a half times the average while overtaking static vehicles on the offside (372.42% of the average), and nearly four times the average while overtaking a moving vehicle on the offside (399.55% of the average). Motorcycles also experienced collisions more frequently on left-hand bends (157.68% of the average) than on right-hand bends (130.68% of the average).
Buses or coaches faced the most disproportionate occurrence of collisions while moving off and slowing or stopping. In addition, they had over three times the average rate of collisions while moving off (309.28% of the average) and over twice the rate of collisions (217.55% of the average) while slowing or stopping.
Light goods vehicles were disproportionately at risk while reversing (253.35% of the average), while performing a U-turn (145.88% of the average), and while parked (142.75% of the average).
Pedal cycles were disproportionately involved in collisions when going ahead while not on a bend, facing collisions over 50% more than the average (155.22% of the average).
Table showing each recorded manoeuvre and which vehicle type has the greatest difference in collision occurrences from the average for each manoeuvre
Advertisement
| Manoeuvre | Vehicle type with greatest difference in collision occurrences | Vehicle’s involvement in all accidents | Vehicle’s involvement in accidents caused by this manoeuvre | Increase compared to vehicle’s involvement in all crashes |
| Changing lane to left | Heavy goods vehicles | 2.33% | 13.66% | 585.60% |
| Changing lane to right | Heavy goods vehicles | 2.33% | 12.44% | 533.37% |
| Going ahead left-hand bend | Motorcycles | 8.01% | 12.63% | 157.68% |
| Going ahead other | Pedal cycles | 7.9% | 12.27% | 155.22% |
| Going ahead right-hand bend | Motorcycles | 8.01% | 10.47% | 130.68% |
| Moving off | Buses or coaches | 2.04% | 6.31% | 309.28% |
| Overtaking – nearside | Motorcycles | 8.01% | 25.79% | 321.93% |
| Overtaking moving vehicle – offside | Motorcycles | 8.01% | 32.01% | 399.55% |
| Overtaking static vehicle – offside | Motorcycles | 8.01% | 29.84% | 372.42% |
| Parked | Light goods vehicles | 5.41% | 7.73% | 142.75% |
| Reversing | Light goods vehicles | 5.41% | 13.71% | 253.35% |
| Slowing or stopping | Buses or coaches | 2.04% | 4.44% | 217.55% |
| Turning left | Light goods vehicles | 5.41% | 6.74% | 124.54% |
| Turning right | Cars | 72.91% | 83.31% | 114.25% |
| U-turn | Light goods vehicles | 5.41% | 7.9% | 145.88% |
| Waiting to go – held up | Cars | 72.91% | 85.17% | 116.81% |
| Waiting to turn left | Cars | 72.91% | 85.41% | 117.14% |
| Waiting to turn right | Cars | 72.91% | 85.03% | 116.62% |
Source: Department for Transport
Kevin Pratt, car insurance spokesperson at Forbes Advisor, said:
“Accidents will always happen, but it’s worth remembering that the vast majority are caused by human error. Drivers who are risk aware, cautious and focused on what they are doing can improve their chances of avoiding collisions.
“Modern cars are designed to make driving easier and safer, but the danger is that drivers can become complacent and distracted, perhaps reviewing a satnav screen or choosing what music to listen to instead of concentrating on the road and other traffic. And there are times when absolute focus is essential, whether it is turning right across oncoming traffic or bringing the vehicle to a safe stop.
“Anyone who can recognise and respond to high-risk situations will be a safer driver. Anyone who takes risks or doesn’t pay due care and attention will be a danger to themselves and to others.”
The study was conducted by Forbes Advisor, whose editorial team boasts decades of experience in the personal finance space. It is passionate about helping consumers make financial decisions and choose financial products that are right for their lives and goals.
The team brings rich industry knowledge to Forbes Advisor’s coverage of consumer credit, banking, investing, insurance, loans, mortgages, and property. Its priority is ensuring its coverage, reviews and guidance is backed by research, expertise, and strict methodologies.
Table showing the number of collisions recorded for each vehicle type for all known manoeuvres in each year from 2012 to 2021
Advertisement
| Vehicle type | 2012 | 2013 | 2014 | 2015 | 2016 | 2017 | 2018 | 2019 | 2020 | 2021 |
| Pedal cycles | 19,708 | 20,049 | 21,978 | 19,428 | 18,968 | 18,415 | 16,344 | 15,535 | 14,699 | 14,613 |
| Motorcycles | 20,171 | 19,537 | 21,378 | 20,989 | 20,380 | 18,957 | 17,196 | 16,099 | 12,920 | 14,616 |
| Cars | 197,386 | 185,745 | 195,572 | 188,768 | 184,600 | 171,365 | 158,064 | 149,053 | 108,510 | 119,535 |
| Buses or coaches | 6,318 | 5,895 | 6,101 | 5,379 | 4,981 | 4,928 | 4,387 | 3,746 | 2,091 | 2,553 |
| Light goods vehicles | 12,575 | 12,681 | 14,042 | 13,876 | 13,094 | 12,291 | 11,585 | 11,868 | 9,565 | 11,535 |
| Heavy goods vehicles | 6,720 | 6,521 | 6,873 | 6,469 | 5,808 | 5,100 | 4,609 | 4,248 | 3,284 | 3,443 |
| Other or unknown vehicles | 2,996 | 2,442 | 2,574 | 2,791 | 3,727 | 3,913 | 3,718 | 2,769 | 2,782 | 3,877 |
| All Vehicles | 265,874 | 252,870 | 268,518 | 257,700 | 251,558 | 234,969 | 215,903 | 203,318 | 153,851 | 170,172 |
Source: Department for Transport
Other or unknown vehicles include all vehicles that are not in the main vehicle type list; these include ridden horses, goods vehicles with unknown weight and unknown vehicle types.

